
Written by Erica Madonna, former researcher at the Bjerknes Centre and the Geophysical Institute at the University of Bergen, and the Nansen Legacy
Ocean currents transport heat poleward from the North Atlantic to the Arctic, influencing ice formation and melting. Climate models are key to understanding the future evolution of the Arctic system, but they struggle to represent the present sea ice variability and the observed long-term trends.
In this study, we investigate why climate models from the Coupled Model Intercomparison Project (CMIP) yield different ocean heat transports in the Nordic and Barents Seas. We find that most of the differences result from discrepancies in the representation of the ocean circulation.
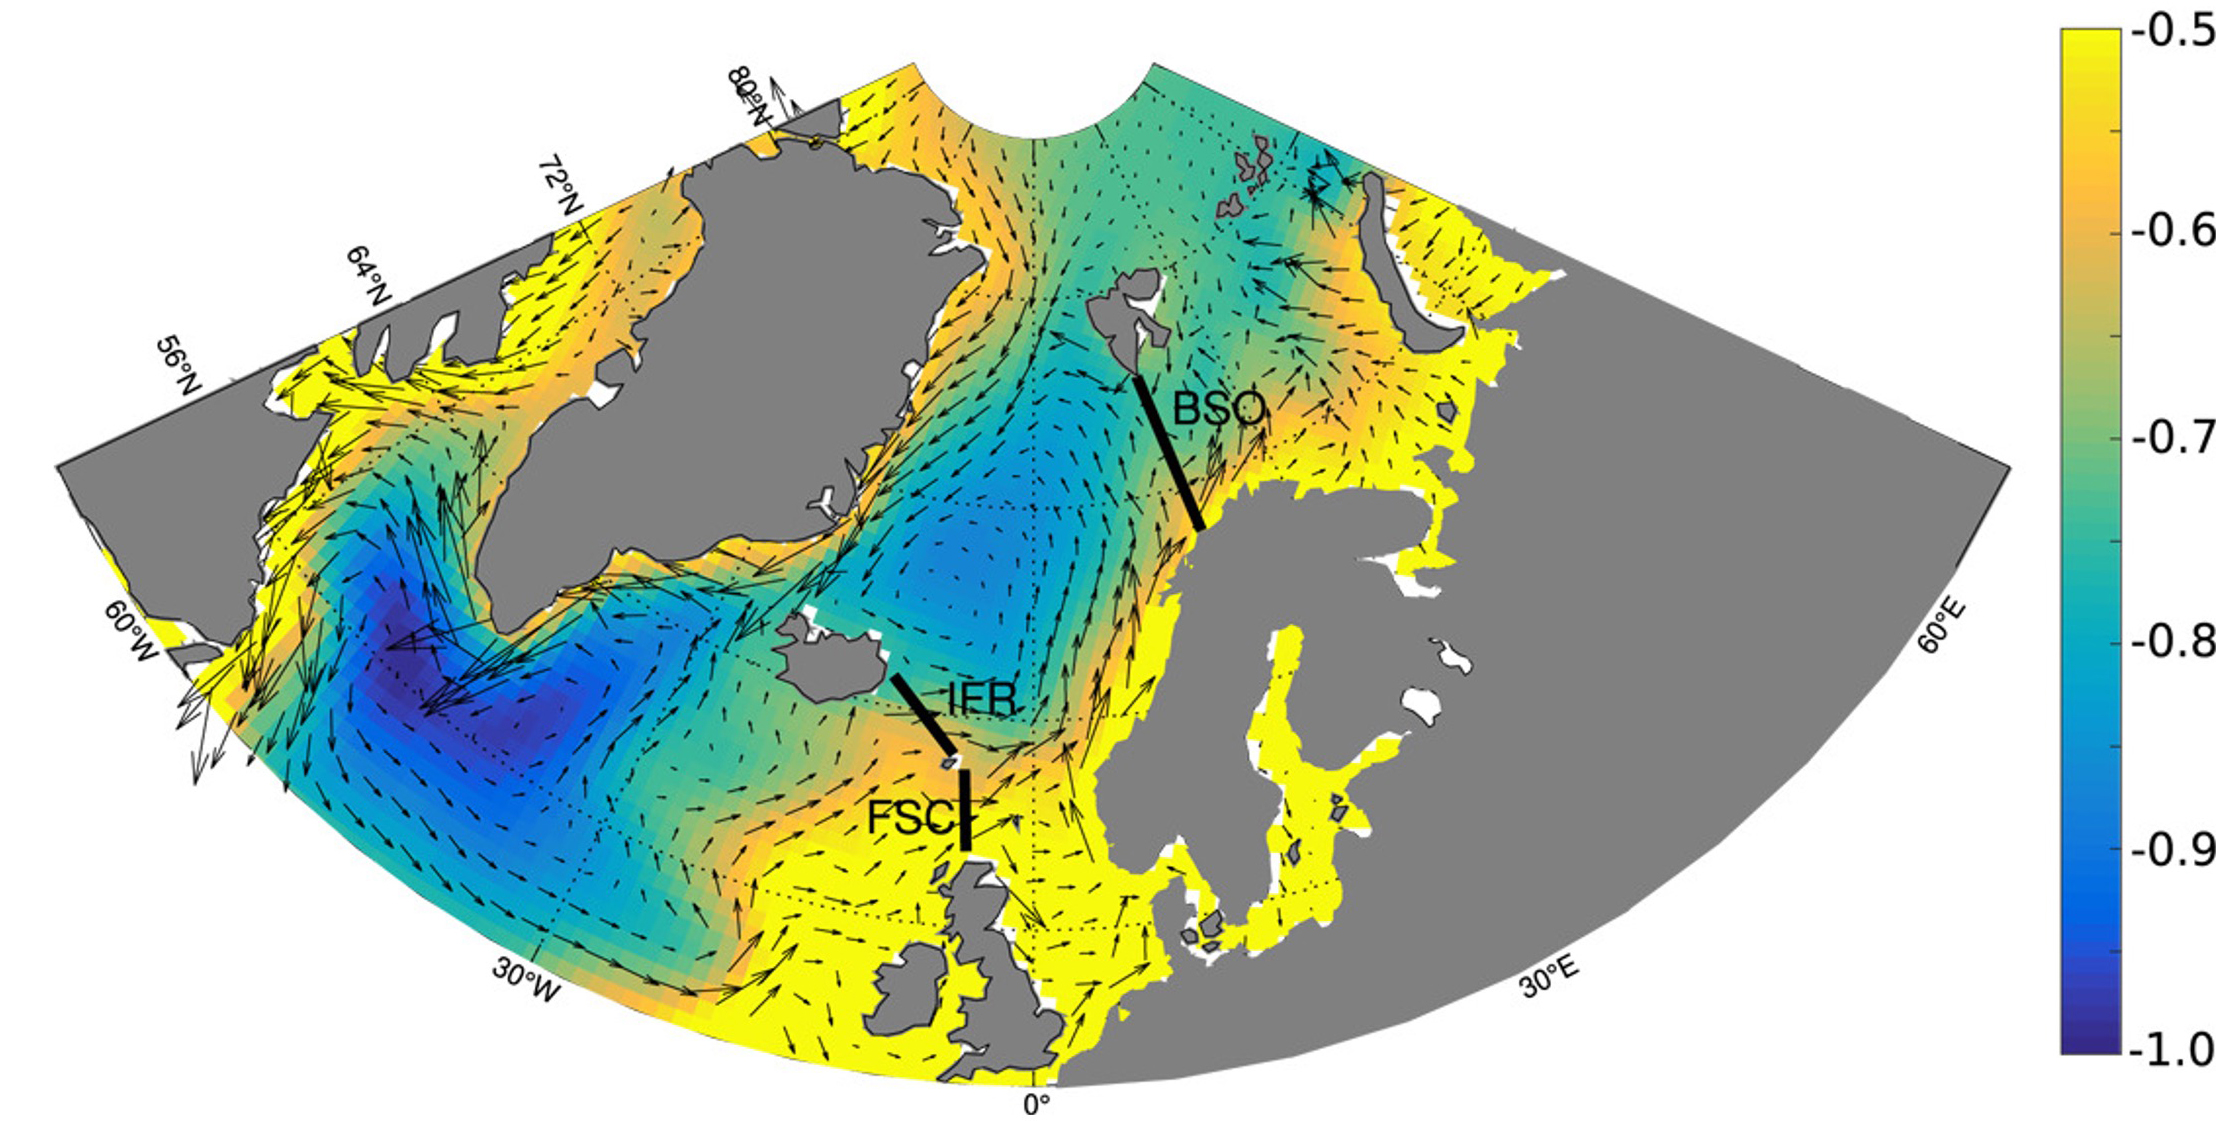
In the North Atlantic warm water flows through the Iceland-Scotland Ridge (ISR), the section encompassing the Iceland-Faroe Ridge (IFR) and Faroe-Shetland Channel (FSC)) transporting heat poleward along the Norwegian coast (Figure 1). Part of this warm current continues through the Barents Sea Opening (BSO), reaching the Barents Sea and contributes to sea ice melting.
The ocean heat transport (OHT) depends on the amount of transported water (i.e., the ocean volume transport, OVT) and its temperature (T100m).
In this study we look at these three specific aspects (OHT, OVT, and T100m) across 15 CMIP5 and 9 CMIP6 models at the Iceland-Scotland Ridge and Barents Sea Opening. We also consider the atmospheric wind forcing of these models and how it influences both the ocean heat transport mean state and variability.
The main findings of the study are summarized in Figure 2. CMIP models show large intermodel differences in ocean heat transport with biases of several terawatts at both locations (Figure 2a,b). Compared to CMIP5 models, the analyzed CMIP6 models give a better representation of ocean mean temperatures (Figure 2e,f), resulting in ocean heat transports closer to observations. For the analyzed CMIP6 models, the differences in the mean ocean heat transport is rather linked to the different representation of the ocean currents (i.e., the ocean volume transport, Figure 2c,d).
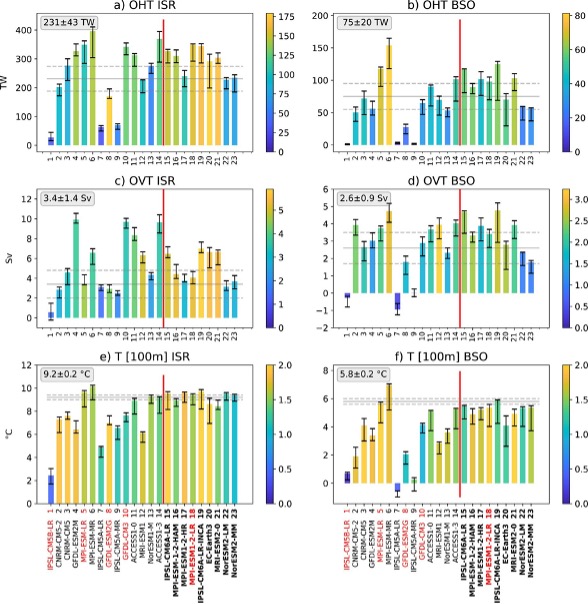
We find that at both locations the ocean heat transport variability is strongly controlled by ocean volume transport on shorter (monthly) and longer (multi-annual) time scales. On longer time scales temperature changes are also important for the heat transport variability, especially at the Barents Sea Opening, where variations of ocean volume transport and temperature are often in phase.
Much of the short-term variability in ocean heat transport and ocean volume transport is driven by wind variability south of Iceland and along the Norwegian coast. This link is present in all models, but the magnitude of the ocean response to wind forcing is model dependent.
Reference
Madonna, E. & Sandø, A. B. (2022). Understanding differences in North Atlantic poleward ocean heat transport and itsvariability in global climate models. Geophysical Research Letters, 49(1), e2021GL096683.