Written by Willem van der Bilt, Postdoc at the Bjerknes Centre and the Department of Earth Science at the University of Bergen
Climate changes far more quickly in the Arctic than anywhere else on the planet. This amplified response is largely driven by mechanisms that are unique to the region. For example, open water in areas formerly covered by sea ice absorbs much more solar heat. At the same time, freshwater from thawing glaciers can cool things down by disrupting ocean circulation. These so-called feedbacks will affect the trajectory of future change. Yet their climate impacts remain incompletely understood; this undermines the reliability of projections that underpin policy-making.
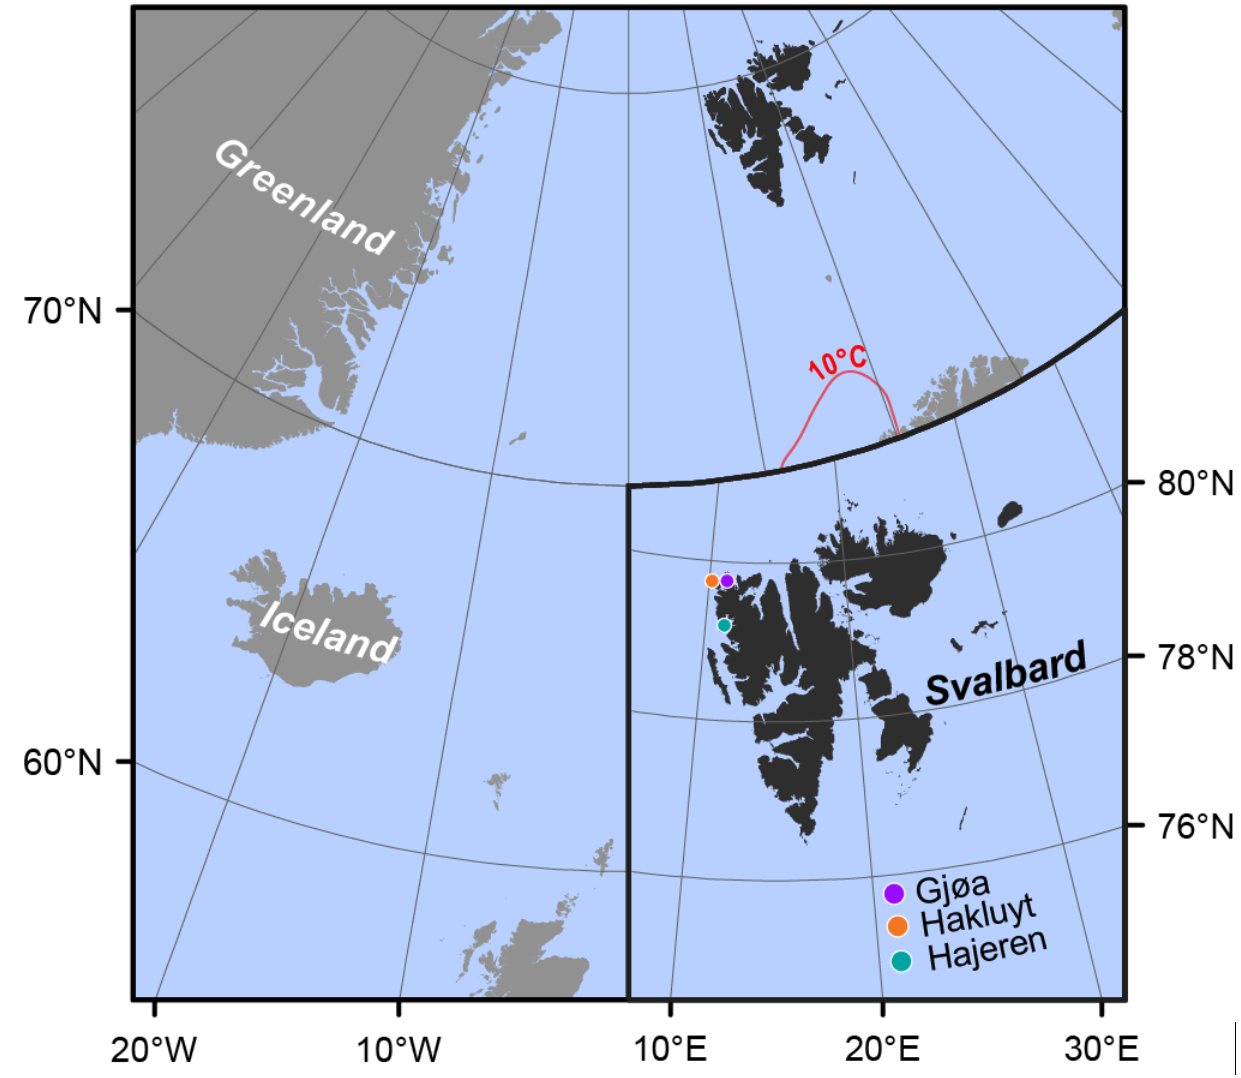
In a new article published in Geophysical Research Letters, we try to reduce these uncertainties by reconstructing Arctic surface temperatures during a past period that was also shaped by disappearing sea ice, melting glaciers and warming temperatures: the Early Holocene epoch, which lasted from 11 700 to 8200 years ago. While change had different causes back then, we can use this period to learn more about the response of the climate system to conditions expected in the future.
Saturation point
But how do you measure temperatures from a long-gone past without a time machine? For our study, we relied on the fat from fossil algae preserved in mud at the bottom of lakes on Svalbard. While this sounds absurd, there is method to this madness. For starters, lakes act like archives –storing environmental information in fresh layers of mud, year after year. Sequences of lake mud may contain tens of thousands of years of data: to get these unique records from the dark cold depths of Arctic lakes, we hammer plastic tubes into their bottoms and fill them with mud. Now, there are many different characteristics of these mud layers that provide us with information about past climate conditions. Particularly well-known examples of such proxies include plant pollen – providing information about vegetation change, or organic matter – reflecting growing conditions.
We opted for a more avant-garde approach, which relies on the temperature sensitivity of the composition of fats produced by algae. To wrap your head around this, think about what happens to a lump of butter in a warm pan – it melts. Needless to say, this response is pretty inconvenient when it concerns tissue fat: imagine turning into a liquid on a hot summer day. To avoid this embarrassment, our algae change the composition of their body fat to make sure they maintain the same consistency when the temperature of their environment changes. To this end, they build or break double bonds between the carbon atoms of fat molecules – a process known as saturation. In other words, the degree of saturation of these compounds holds information about past temperature conditions. And new technology allows us to extract and measure these tiny molecules from prehistoric mud. Even better, calibration studies enable us to convert saturation to degrees °C.

Warmer than today
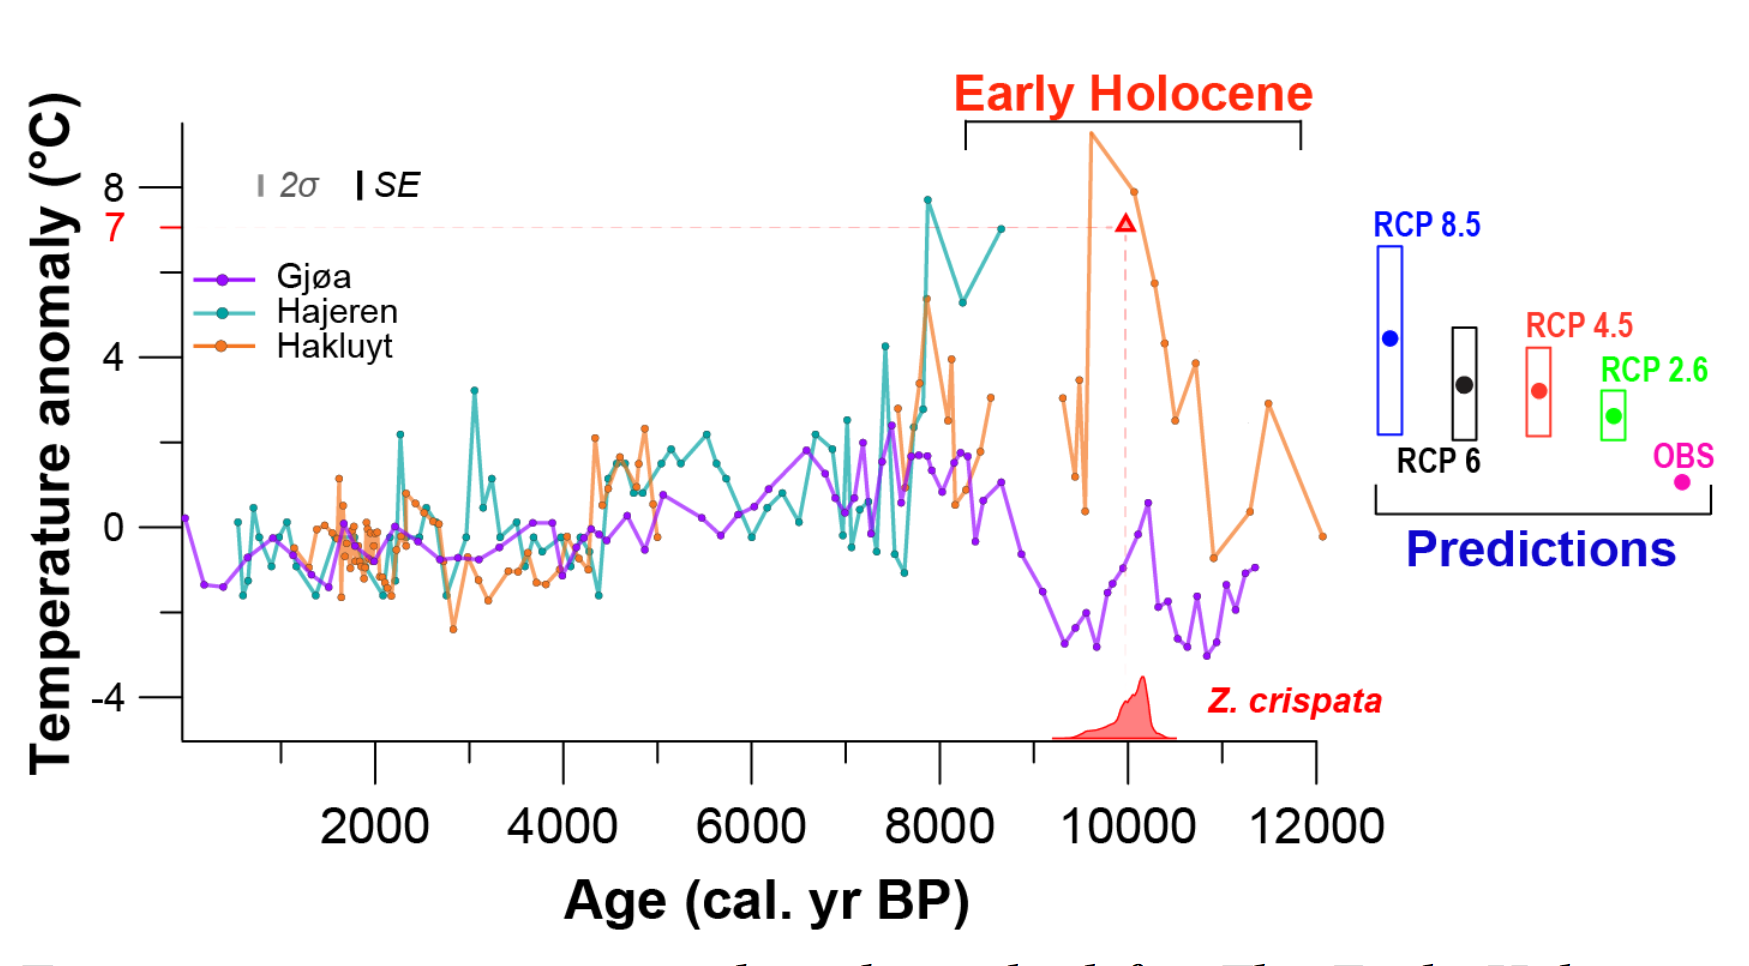
Algal fat from Early Holocene sediments told us that temperatures were warmer than today. And not just a little bit, but up to 7 degrees! At first, we were skeptical about this find: if this was true, the Early Holocene was as warm as some of the more extreme predictions for the end of this century. Yet new measurements from different lakes and refined calibration methods confirmed our results time and again. But in the end, it was additional information from an unusual source that convinced us to publish our findings: clams.
Many decades ago, researchers collected and dated mollusc shells from former beaches to reconstruct the sea-level history of Svalbard. Identification of their taxonomy yields valuable information about environmental conditions, as the various species found thrive under different conditions. Specimens that lived during our Early Holocene warming peak belonged to a species that at present does not venture north of Norway today – where conditions are 6 degrees warmer than on Svalbard.
But to all the climate sceptics out there: don`t get too excited, because Early Holocene warming rates were an order of magnitude smaller than those seen today.
Double whammy
Closer investigation of our data reveals that peak warmth is confined to a geologically speaking brief 1 000 year period around 10 000 years ago. At the time, the amount of solar heat that reached the Arctic in summer was significantly higher than today. However, this radiation maximum lasted for thousands of years; only an additional shorter-lived forcing mechanism can explain the inferred pattern of warming. Investigation of other geological records from the area provided a likely culprit: ocean circulation. Our warming peak coincides with similarly timed and equally brief maxima in surface ocean temperatures and bottom current strength. As ocean circulation resumed at the end of the last Ice Age 12 000 years ago, large volumes of warm water that had piled up in the tropics were exported to the Arctic; a double whammy of solar and ocean heat sent temperatures soaring.
Hot and cold
We didn`t have much time to recovery from the surprise of our discovery that temperatures were higher than today; filling in the gaps and resolving Svalbard`s Early Holocene temperature history at greater resolution, we also detected pronounced cold spells that lasted mere decades. Blowing hot and cold, the early Holocene covered all temperature extremes since the last Ice Age. Which begs the question: how can conditions be warmer ad well as colder than today during the same period? Sensitivity studies performed with climate models provide a compelling explanation: melting ice. Over the past decades, evidence has mounted that North Atlantic climate was perturbed by meltwater outbursts from the decaying Ice Sheet that covered North America. By hosing large amounts of light and cold freshwater into the ocean, these events chilled things down and disturbed density-driven ocean circulation. Indeed, the timing of extreme cooling phases coincide with major meltwater pulses: our findings provide the first evidence that these events impacted Svalbard.

So what?
Let`s take a deep breath, step back and zoom out to reflect on the big picture; does our paper provide information about what the future has in store for us? Quite possibly, we dare say. We are facing an Arctic that is warming so rapidly that those Early Holocene temperature peaks are likely reached by the end of this century. At the same time, the accompanying demise of the Greenland Ice Sheet, which has really started to ramp up over the last few years, will generate freshwater fluxes so large that they may well hinder North Atlantic ocean circulation and cool things down. Our findings may thus provide a rare window into the future response of the Arctic`s climate system.
Reference
Van der Bilt, W.G.M., Andrea, W.J., Werner, J.P., Bakke, J., 2019. Early Holocene temperature oscillations exceed amplitude of observed and projected warming in Svalbard lakes. Geophysical Research Letters.

