Written by Balamuralli Rajasakaren from the Bjerknes Centre and NORCE Norwegian Research Centre.
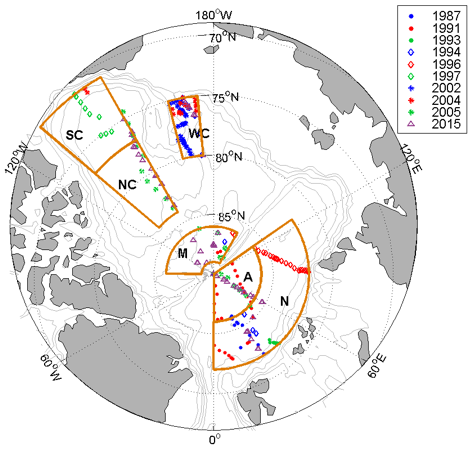
Anthropogenic carbon is not directly measurable, and trends in the Arctic Ocean are not well understood. Our new study evaluates the decadal trends in anthropogenic carbon in the different sub-basins of the Arctic Ocean between 1987 and 2015.

In this paper, anthropogenic carbon (Cant) and mean ages of the water masses are estimated using the transit time distribution (TTD) method.
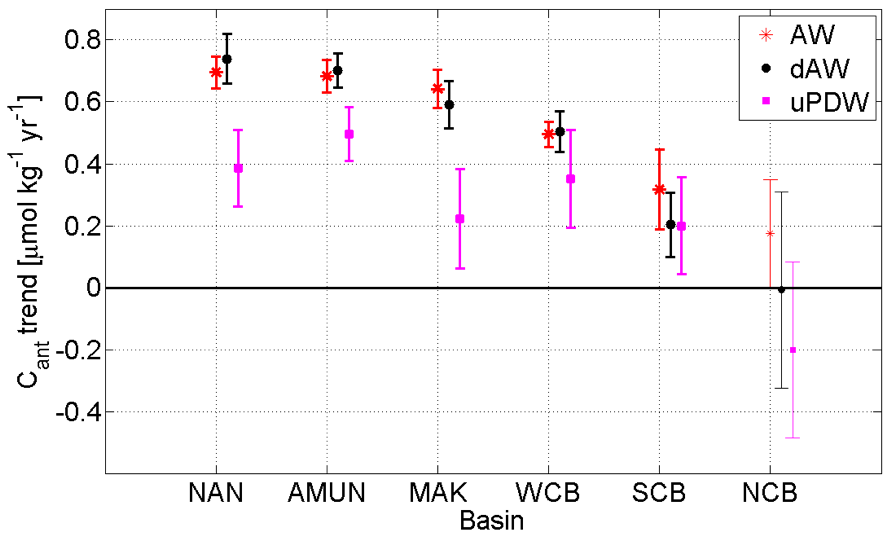
We found that the highest Cant trend is observed in the Nansen sub-basin and lowest trend in the South Canadian sub-basin. This follows the circulation of the Arctic Circumpolar Boundary Current (ACBC), where the largest trends are in the inflow region of the Atlantic Water on the Eurasian side of the Arctic Ocean, and the trend decreases as the waters travel further into the Amerasian side of the Arctic Ocean.
The mean age trends as well as the year the waters were exposed to the atmosphere indicate that Cant trends are primarily governed by ventilation. This leads to an increase in the Cant column inventory of about 0.7 – 1.0 mol C m-2 yr-1 in the Nansen, Amundsen and Makarov sub-basins.

Reference
Rajasakaren, B., Jeansson, E., Olsen, A., Tanhua, T., Johannessen, T., Smethie, W.M., 2019. Trends in anthropogenic carbon in the Arctic Ocean. Progress in Oceanography, 178, 102177, https://doi.org/10.1016/j.pocean.2019.102177.

