Translated by Elsa du Plessis
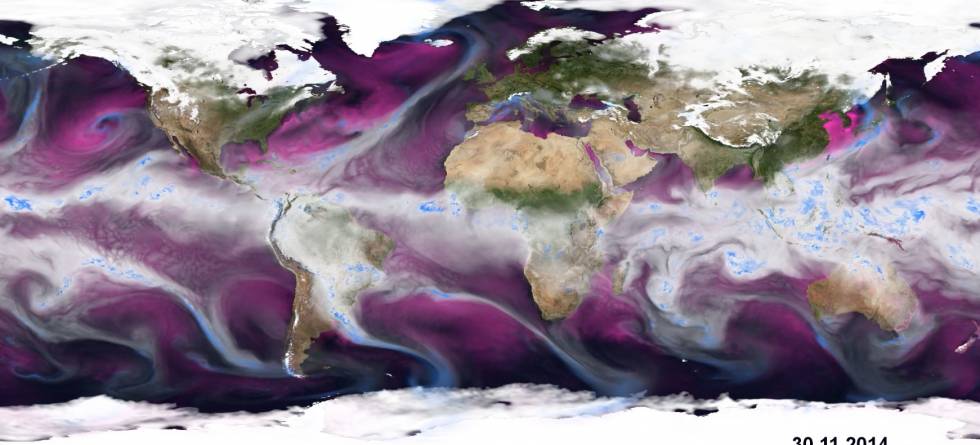
The new animation shows moisture transport in the atmosphere from 1st September until 30th November 2014. In it you can see precipitation, evaporation and moisture content in the atmosphere and watch how they move across the globe. At the same time you can see the sea ice grow in the Arctic and the new winter’s snow settling across North America, northern Europe and Russia.
Watch the large amount of precipitation moving over the north Atlantic and into the west coast of Norway from 26th to 28th October, resulting in the flooding in Odda and Flåm on the west coast of Norway. Around the same time you will also see the Alps turning white.
Shades of white indicate the total moisture content in the atmosphere, most of which is water vapour. Pink shades indicate the amount of evaporation, while blue shades show precipitation.
Mats Bentsen, researcher at Uni Research and the Bjerknes Centre, created the animation and received help from Øyvind Breivik at the Norwegian Meteorological Institute in downloading the historical weather forecast data from ECMWF (European Centre for Medium Range Weather Forecast). The animation was created using a weather forecasting model with stored forecast data. The background is a composite image made from satellite data made by NASA's Earth Observatory.
Bentsen lists a series of interesting weather phenomena that you can see in the animation, in addition to the heavy rainfall of 26th to 28th October mentioned earlier:
Tropical cyclones in the Atlantic (category 4 or higher):
- Gonzalo, 12th - 20th October,
Tropical cyclones in the eastern Pacific Ocean (category 4 or higher):
- Odile, 10th-18th September,
- Simon, 1st-7th October,
Tropical cyclones in the western Pacific Ocean (category 4 or higher):
- Kalmaegi, 11th-18th September,
- Phanfone, 28th-6th October,
- Vongfong, 2nd-14th October,
- Nuri, 30th-14th November.
Tropical cyclones in the Indian Ocean (category 4 or higher):
- Hudhud, 7th-14th October,
- Nilofar, 25th-31th October.
A straight white streak over Finland
The animation clearly shows snowfalls. Looking east of Central Norway on 5th November, you can see the precipitation drawing a white brush stroke of snow over the landscape across to Sweden and Finland.
“It’s new to me that we can get such sharp lines. One can follow the precipitation moving rapidly westward, resulting in this spectacular pattern of snow. I have no reason to believe that there is anything wrong with the model, but one should probably discuss this with a meteorologist or hydrologist,” says Bentsen, who mostly works on developing climate models.
An extreme snowfall in Nepal on 15th October is clearly visible in the animation. This snowfall, unusual for this time of year, was formed in the remains of the tropical cyclone Hudhud (se above). More than 20 people were killed in blizzards and avalanches linked to this event.
The pink shades occasionally lighting up show evaporation. Evaporation is most visible over the ocean, but there is a strong daily cycle visible over land at lower latitudes.
“Evaporation is a function of humidity contrasts between the ocean surface and the air above, as well as wind. In some cases it is very strong. On 22nd October in the Mediterranean we see a situation with wind blowing from the north. The air’s ability to hold humidity rises with temperature. The Mediterranean is warm in general and the wind relatively strong, cool and dry so that in this case we see extreme evaporation. We also see this over areas where we know there is a lot of evaporation, for example in the extension of the Gulf Stream in towards our own seas, and in the Kuroshio current off Japan. These are ocean currents that bring warm water northwards,” says Bentsen.
We also see evaporation around low-pressure systems, as you can see just west of California on 30th November. The low-pressure system is seen as a spiral of humidity and precipitation. Cold, dry air from the north moves in behind the low pressure centre, and here you see the evaporation in pink surrounding the innermost spiral of precipitation in blue.
You can also find the animation on Vimeo:
Water transport in the Atmosphere Sept-Nov 2014 from The Bjerknes Centre on Vimeo.