News
09.07.26
Increase in Marine Heatwaves Around Svalbard
Heatwaves in the waters around Svalbard are occurring more often and lasting longer. Today’s heatwave is quickly becoming tomorrow’s normality.
18.06.26
Is Norway prepared for the future?
A new report raises questions about whether Norway is sufficiently prepared for the climate of the future—and what it will take to adapt in the best possible way.
17.06.26
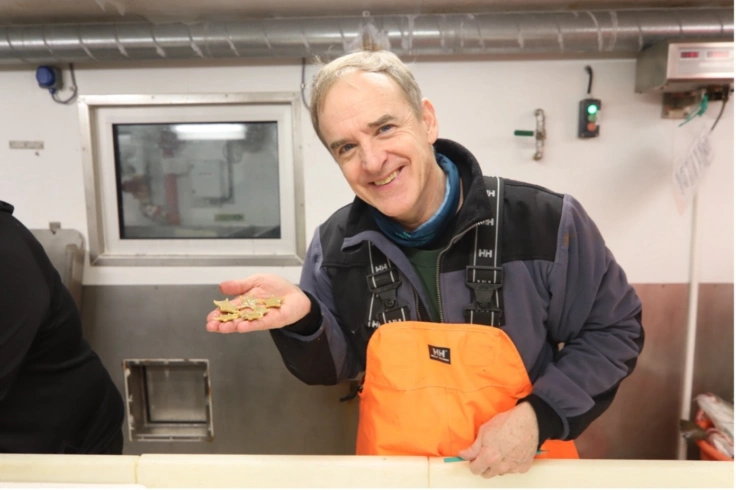
Uniting Norway’s research community for the future of the Arctic Ocean
Paul E. Renaud of Akvaplan-niva has been appointed program director of Arctic Ocean 2050 (Polhavet 2050). He succeeds Bodil Bluhm, who has served as Acting Program Director since January 2026.
08.06.26
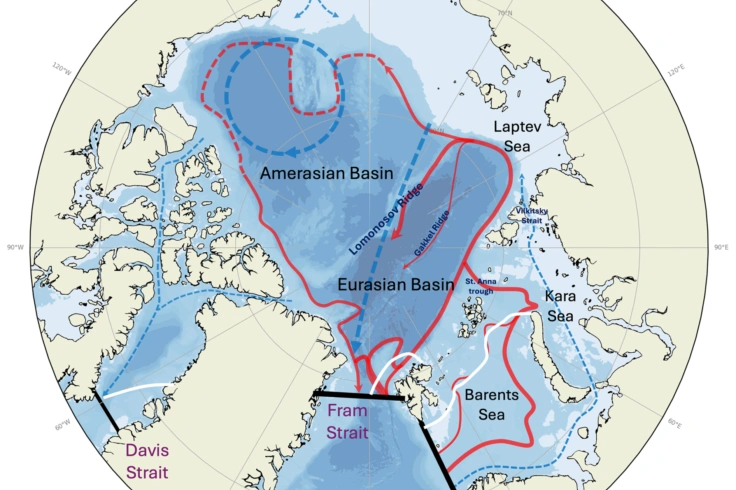
Polar oceans influence the Gulf Stream
The warm Gulf Stream is maintained by coldness. The Barents Sea is a cooling machine.
Tags: Polar, AMOC
01.06.26
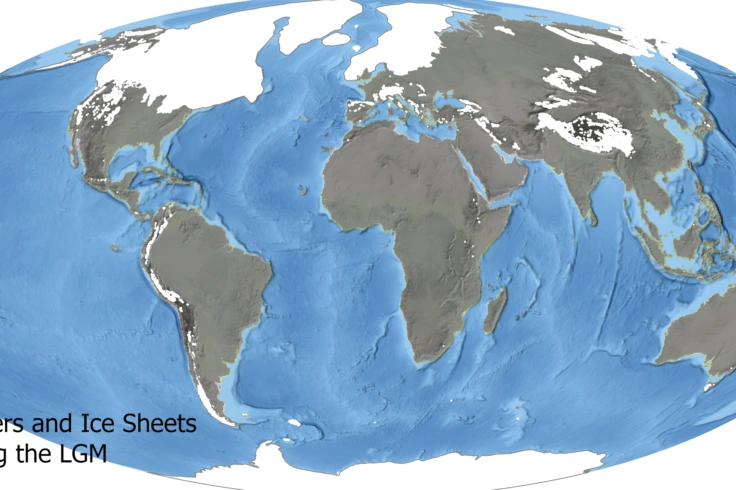
Mapping the world’s vanished glaciers
A global reconstruction of Ice Age mountain glaciers opens new doors for climate and ecosystem research.
11.05.26
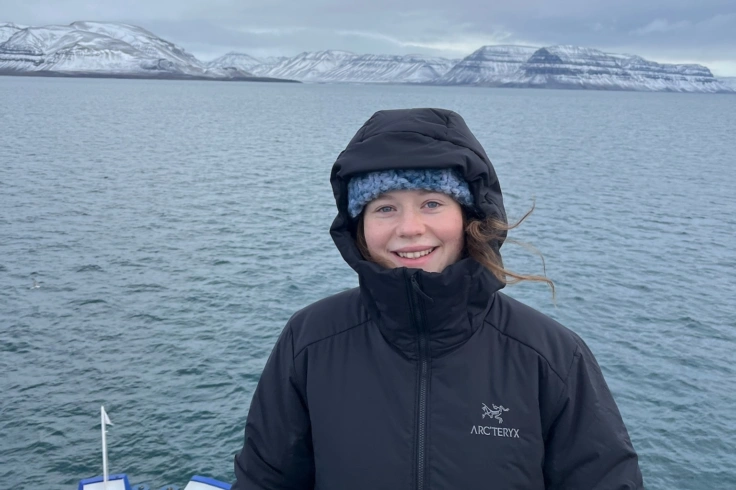
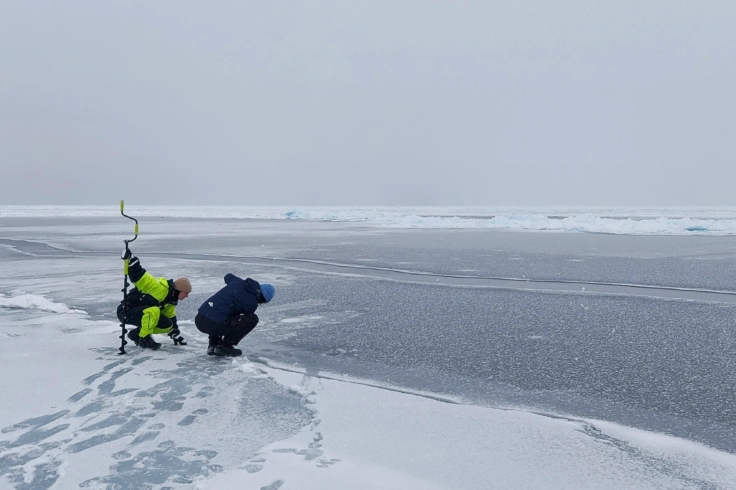
Brutal field trip provided new insights into Arctic winter
It was the hardest field trip they had ever been on, but the result was both surprising and exciting.
29.04.26
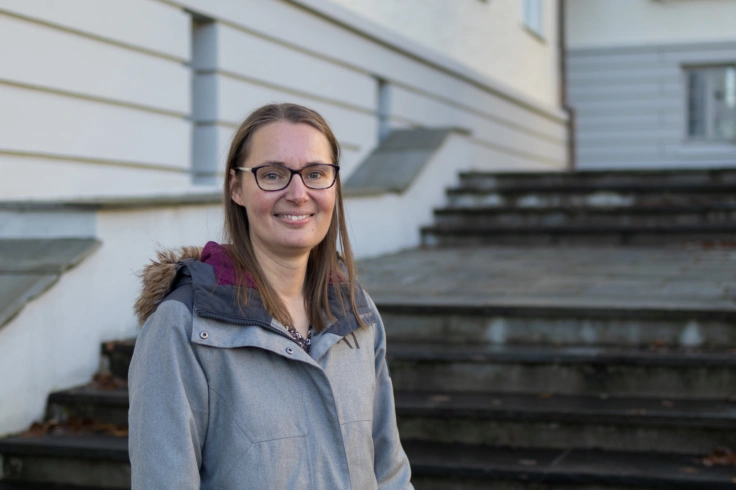
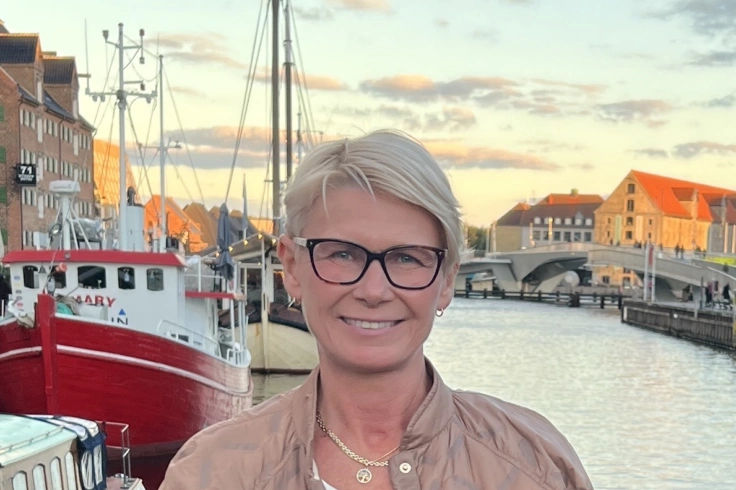
Private rain gauges may improve weather forecasts
Observations from people's gardens have already helped Marie Pontoppidan.
Tags: Hazards, Modeling
27.04.26
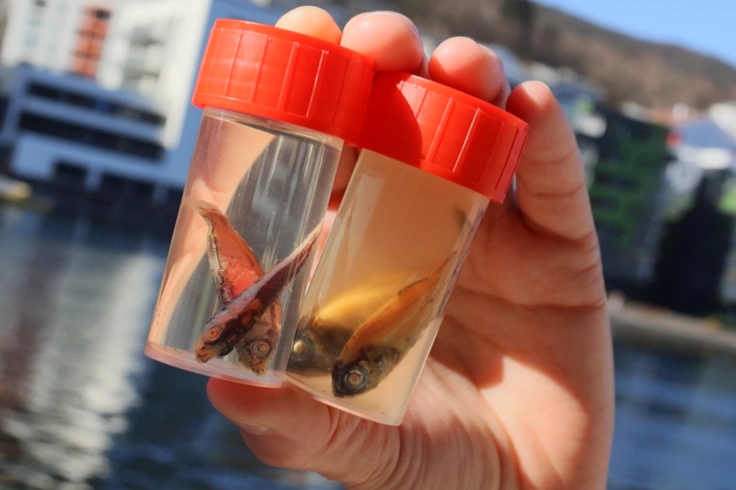
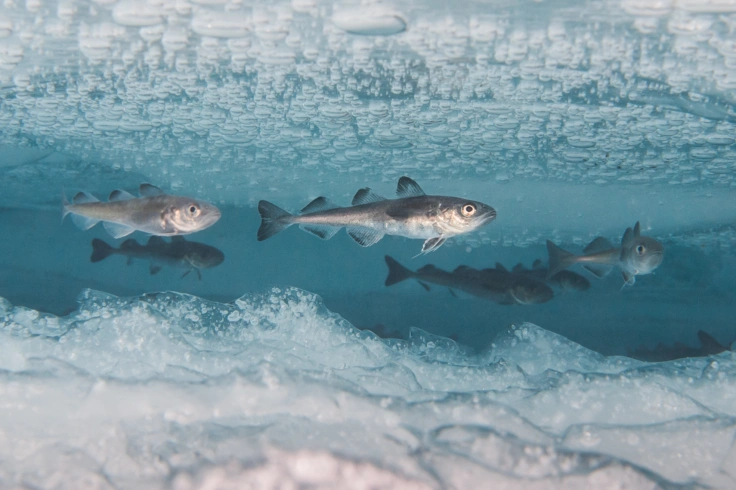
Have you seen these fish?
Out in the open ocean and in the deep fjords here in Norway, a very special type of fish is hiding. It’s a group of fish that there are extremely many of, yet very few people have actually seen. That’s because they are masters of hiding.
20.04.26
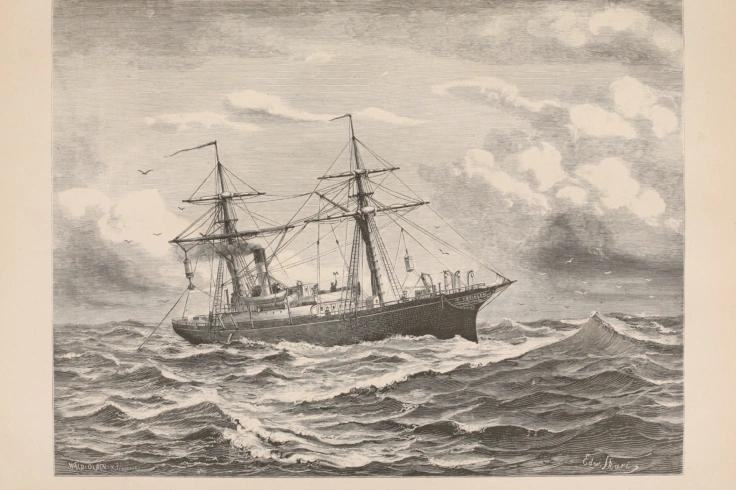
150 years in the Norwegian Sea
The exploration of the ocean west of Norway started for real about 150 years ago. This created the Norwegian Sea.
Tags: Polar
15.04.26
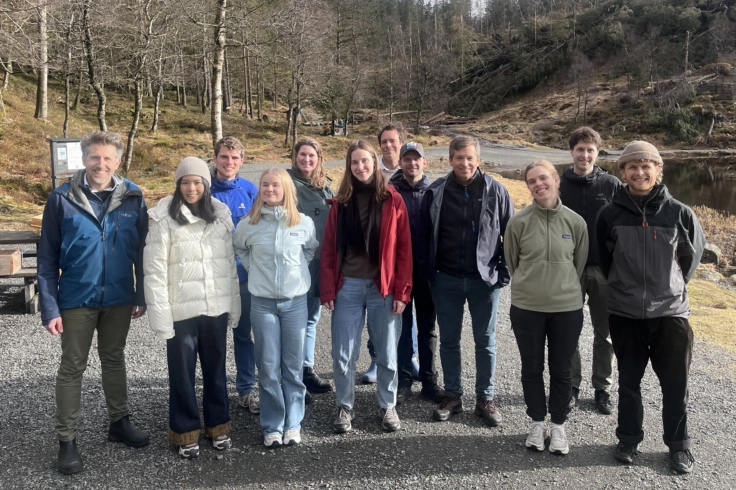
Up and running at the Mountain Centre
Soon, all ten PhD candidates will be in place at the Centre for Mountains in Transition (CMT). Their first field trip is just around the corner.
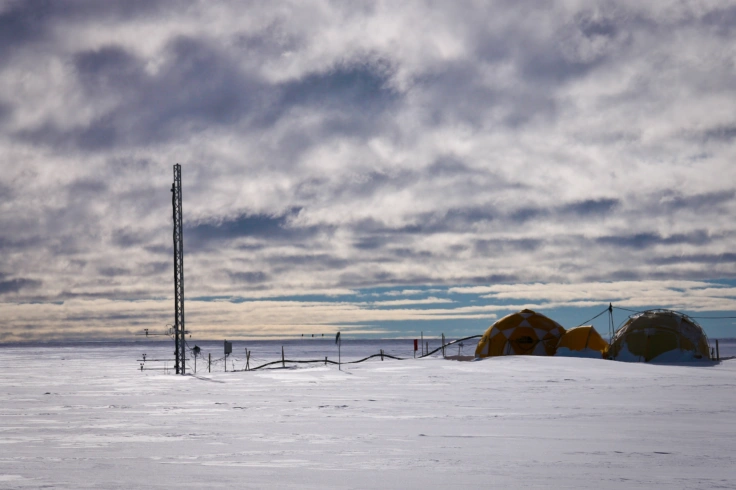
08.04.26
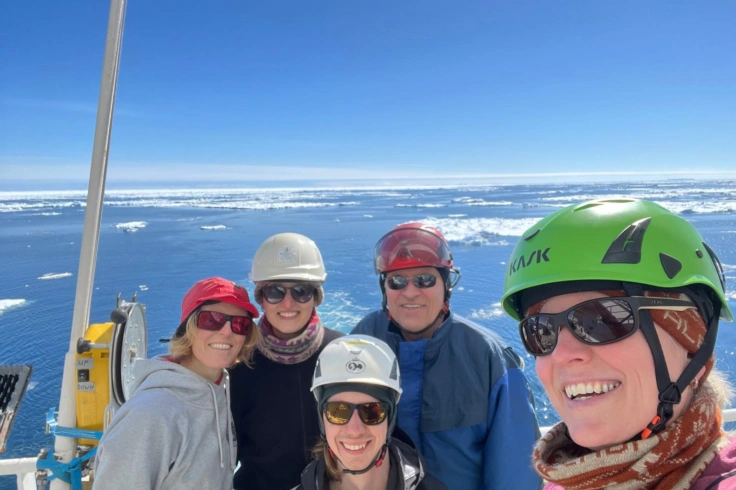
A rough field trip to Antarctica
A research trip to Antarctica is planned a long way ahead, often years. Still, there are many things you do not control. Elin Darelius experienced this on her seventh trip to the Southern Ocean.
24.03.26
Building Bergen’s climate hazard stories
In Bergen, climate risk is shaped by mountains, fjords, and urban forms. Researchers are now translating advanced climate data into local hazard stories for the city’s districts.
22.03.26
Less Sea Ice in the Arctic
This year's sea ice maximum is approaching record low levels – an accelerating trend, according to researchers.
19.03.26
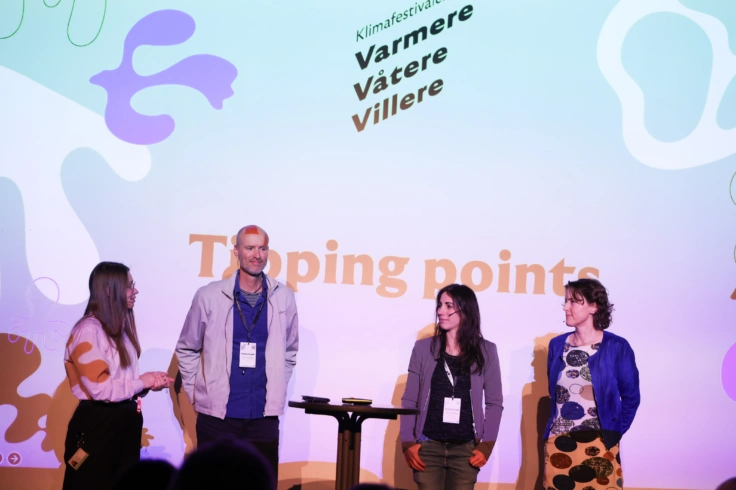
The climate festival “Varmere Våtere Villere" in pictures
There were many Bjerknes researchers in action during the climate festival. Here are some highlights from three days in Bergen.

18.03.26
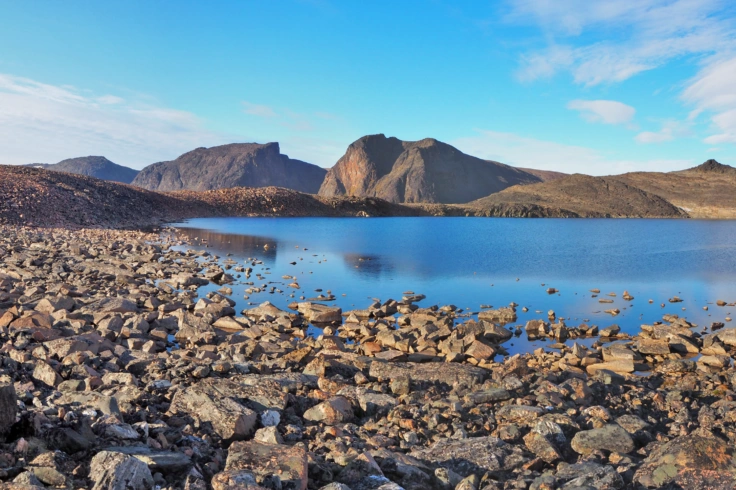
10,000 years of avalanches
At the bottom of a small lake in Hardanger, lies 10,000 years of avalanche history buried. Now, scientists at the Bjerknes Centre and the University of Bergen, has uncovered one of the longest, coherent avalanche records in the world.
03.03.26
A brighter future may not suit everyone
As Arctic sea ice surrenders to open water, the polar buffet expands. For polar fish the times may still be lean. Serving hours fall out of sync with their appetite.
Tags: Polar, fish, light, radiation
16.02.26
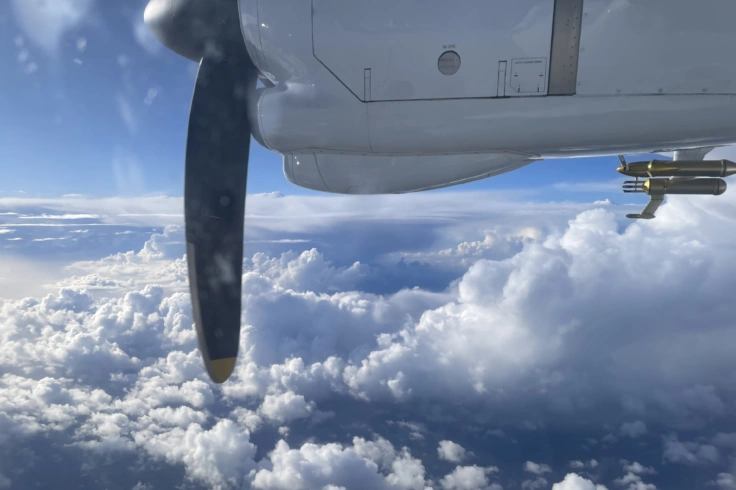
Riding the storm
A large-scale flight campaign on both sides of the Atlantic Ocean aims to uncover why some extratropical cyclones develop into storms, while others fizzle out.
Tags: Global Climate, isotope, cyclone, weather
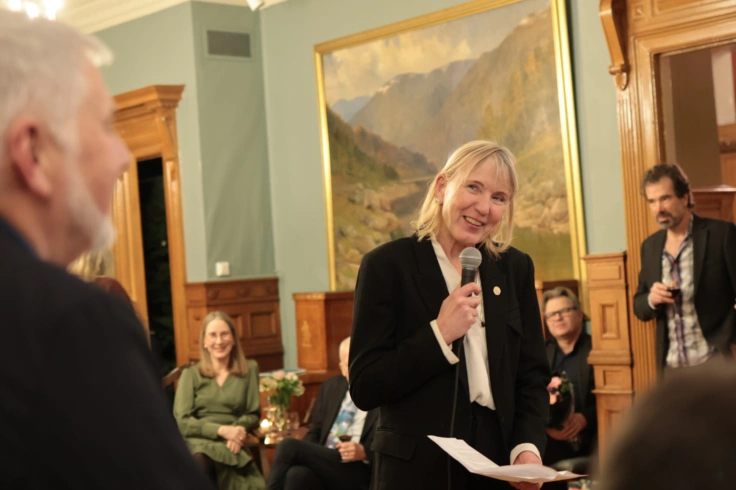
12.02.26
An evening in honor of Prof. Eystein Jansen
"In the spirit of Eystein, it will be a gathering that emphasizes relationships, intellectual exchange, and the path forward, and is intended as a celebration of a vibrant research community", Director Kikki Kleiven introduced the festive seminar in honor of Eystein Jansen..
10.02.26
Multi-model isotope simulations reveal a unified picture of Earth’s water cycle
An international research team has completed the first fully standardized comparison of isotope-enabled climate models, demonstrating that a multi-model ensemble provides the most accurate representation of the present-day global water cycle.

05.02.26
Arctic Ocean 2050
When the summer sea ice in the Arctic Ocean disappears over the next 25 years, the Arctic will be changed forever. To understand what this means for us, the Arctic Ocean 2050 research program will start in 2026.