Building Bergen’s climate hazard stories
In Bergen, climate risk is shaped by mountains, fjords, and urban forms. Researchers are now translating advanced climate data into local hazard stories for the city’s districts.
Publisert 24. March 2026
Written by Tori Pedersen
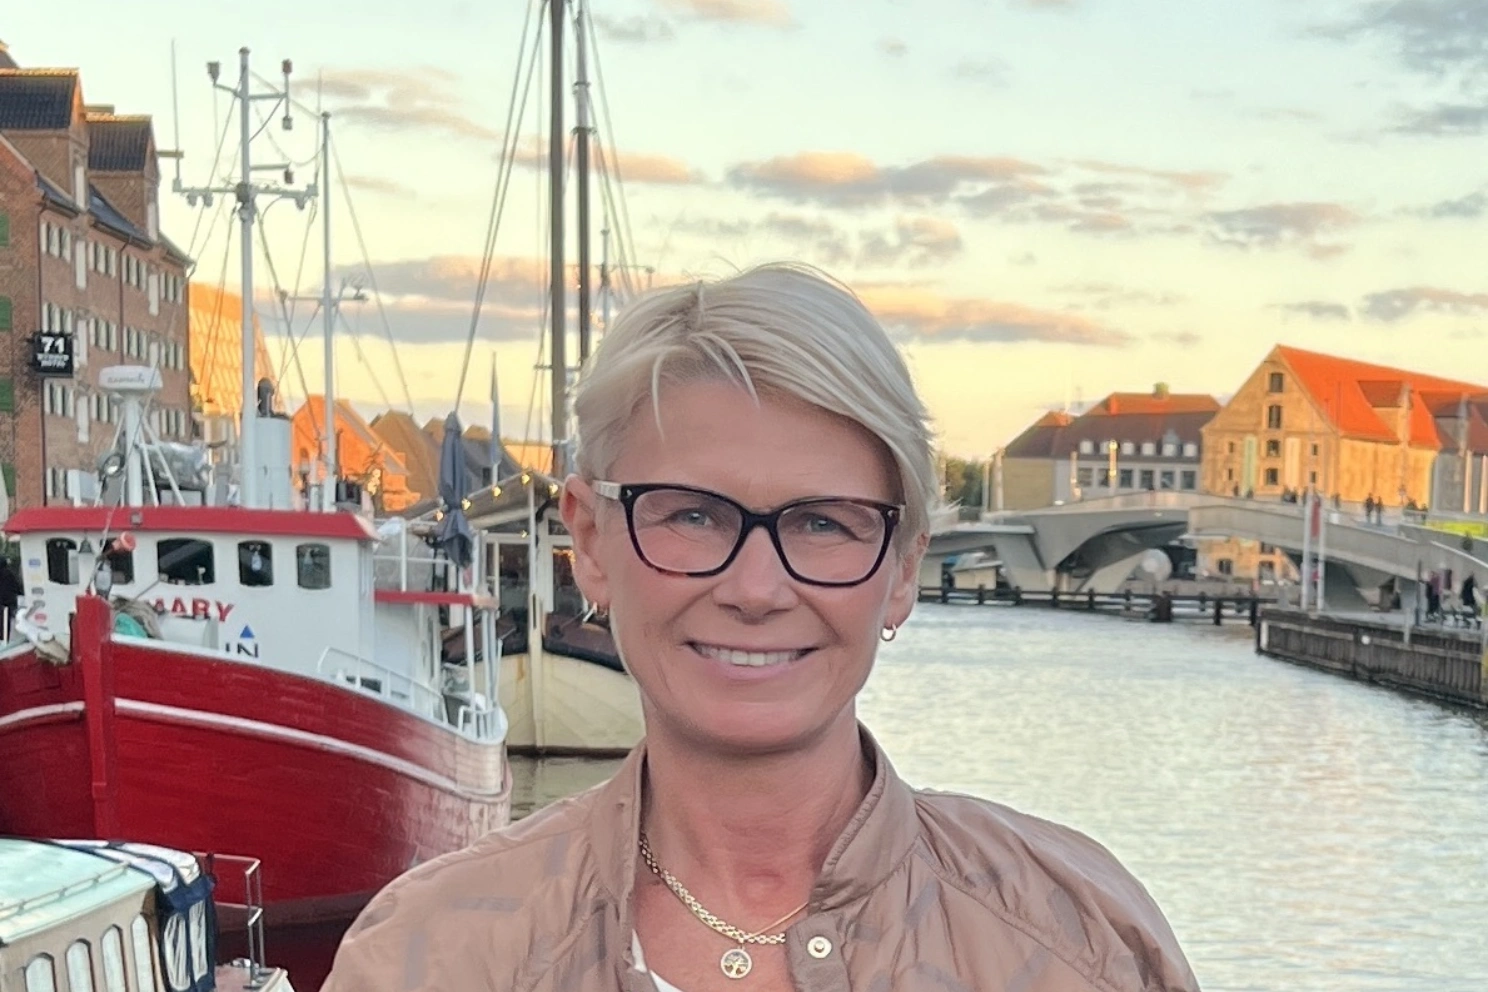
Victoria Miles. Photo: private
Bergen has a bit of everything — steep mountains, narrow valleys, islands, fjords and dense urban neighborhoods. This varied landscape creates equally varied weather and climate conditions. As climate change intensifies, its consequences will not be the same across the city. Each district faces its own challenges.
Different climates
Researchers from the Nansen Environmental and Remote Sensing Center (NERSC) and NORCE, both partners in the Bjerknes Centre for Climate Research, are developing an interactive climate story map for Bergen. The goal is to clearly explain how climate and weather hazards vary between the city’s eight districts — and what those differences mean for the future.
"Bergen has eight districts, and they all have different climates. The hazards we will focus most on are temperature, wind and precipitation,” says researcher Victoria Miles.
Marie Pontoppidan from NORCE will work on providing climate data and general knowledge to ensure relevance.
"This would contribute greatly to our outreach work by giving us good-looking figures to include in local presentations. I also hope to learn more about story-maps creation as I see the potential for using these as deliverables in projects and as outreach in general", Pontoppidan says.
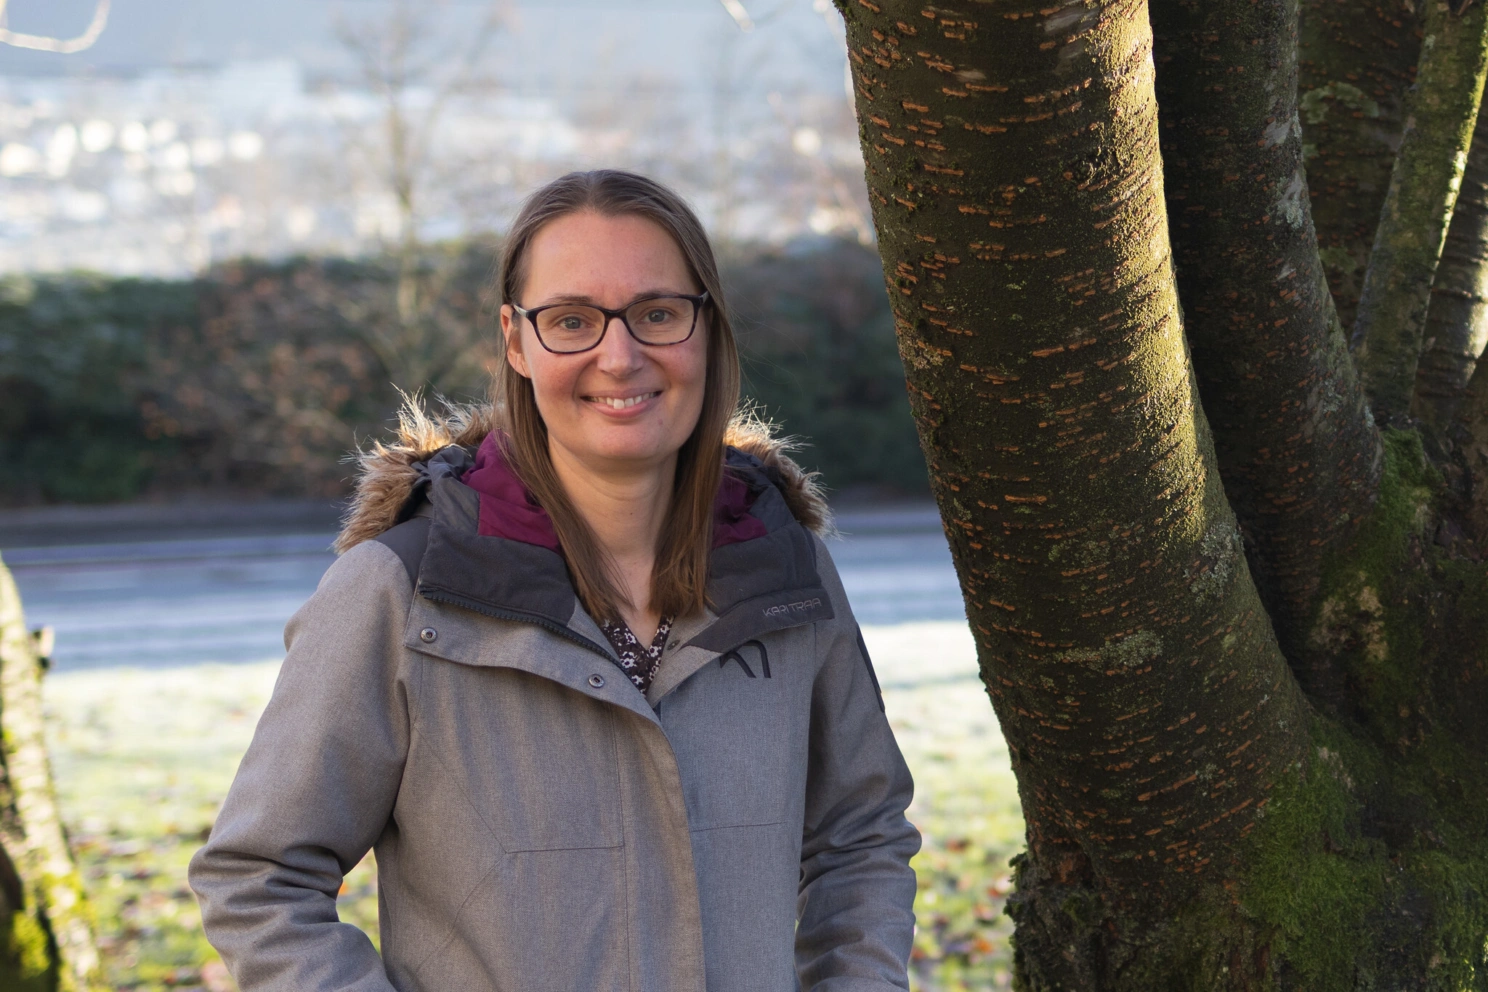
Marie Pontoppidan from NORCE and the Bjerknes Centre is also working on the project. Photo: Ellen Viste / Bjerknes Centre
Stories in a map
The project is built on a simple idea: climate risk in Bergen is always experienced locally. Instead of presenting only city-wide averages, the map will highlight how conditions differ from one district to another - and why. Users will be able to explore their own neighborhood through short explanations, clear visuals and simple interactive maps.
The project has received a fast-track initiative at the Bjerknes Centre. A focused, short-term research activity with the aim of achieving concise results.
The researchers are not starting from scratch. The necessary data already exists from previous climate service and urban climate research projects.
"Over the past years, several projects on climate services have produced detailed and scientifically robust datasets, including analyses of extreme wind and precipitation, land-surface temperatures, air pollution, and vegetation cover. However, much of this information remains difficult for non-experts to access and interpret."
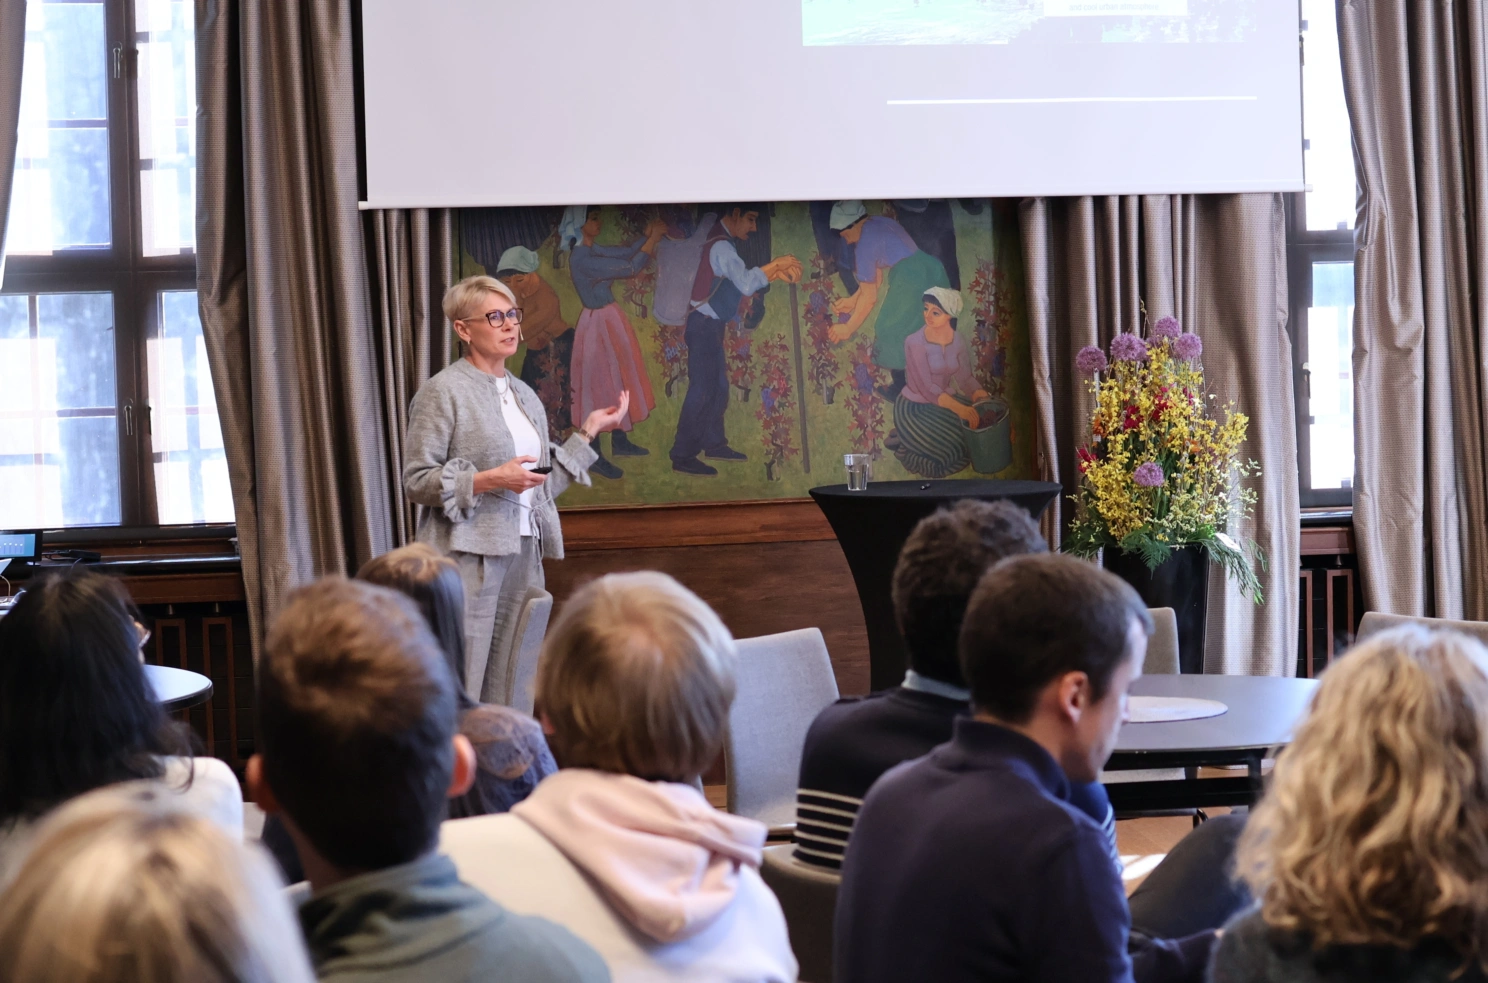
Miles talking about her research at a Bjerknes event. Photo: Tori Pedersen / Bjerknes Centre
Broad audience
The Bergen Climate Atlas aims to bridge that gap. By translating research into an accessible and engaging format, the project will make climate knowledge useful for municipalities, schools and the wider public. It may also provide practical insights for residents — for example, identifying sunnier areas for solar panels or warmer neighborhoods for gardening.
"By connecting scientific data directly to place, we hope to make climate change more understandable, relevant and actionable for everyone in Bergen", Miles says.