Counting his years in CO2
The year Ralph Keeling was born, his father set up a CO2 monitoring station on the volcano Mauna Loa. Almost seventy years later he can read off his age from a curve that became, not just evidence, but a symbol of climate change.
Publisert 16. September 2026
Written by Ellen Viste
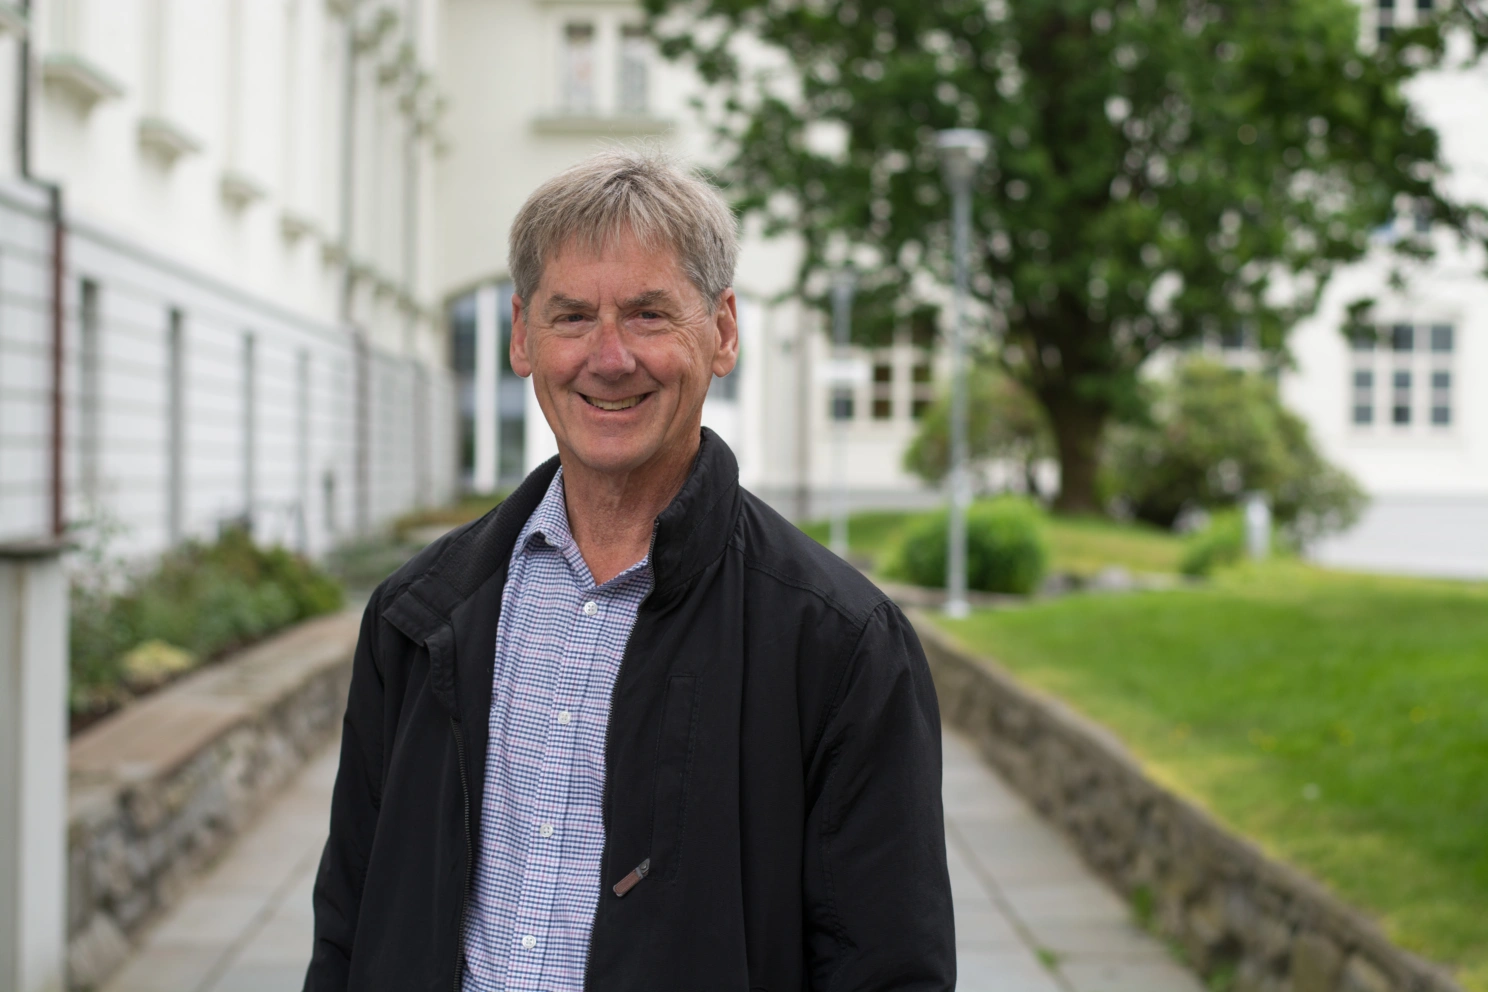
Ralph Keeling is known both for having continued his father's CO2 measurement program and for having shown that the oxygen concentration in the atmosphere sinks due to anthropogenic burning of coal, oil and gas. Photo: Ellen Viste
In 1957 Charles David Keeling installed equipment for measuring CO2 on the volcano Mauna Loa on Hawaii. He had developed a new method.
That the atmospheric CO2 content affects the temperature of the Earth, was shown by the Swedish scientists Svante Arrhenius as early as in 1896. But Arrhenius was concerned with timescales as long as ice ages. He did imagine that emissions from industry could make the Earth warmer, but that hundreds or thousands of years would pass before the change would be noticeable.
Questions about anthropogenic CO2 contributions were not forgotten, but by the time Charles D. Keeling began to take interest in the gas in the 1950s, no clear picture existed. The natural CO2 content of the air seemed to vary from place to place and over time, with disturbances that could not possibly represent the entire globe.
But what if measurements were performed far from people and civilization? For example at the newly built weather observatory on remote Mauna Loa, where the air flowed freely 3394 meters above sea level?
After a decade Charles D. Keeling, who went by “Dave”, could present a graph with a clear direction. The CO2 concentration in the atmosphere was rising.
This data series, now approaching seventy years in length, became known as the Keeling curve, seen as a symbol of climate change. For a long time, it remained a visual expression of changes no one neither saw nor knew the consequences of.
The CO2 data known as the Keeling curve show that the CO2 concentration in the atmosphere has increased by about one third since measurements started in the late 1950s. How much CO2 does the atmosphere contain now compared to the year you were born? Keep the pointer over the curve to see the numbers.
Clean data
«As a teenager I probably already had a sense of what my father was doing and that it was important,» says Ralph Keeling.
As a professor at the Geosciences Research Division at Scripps Institution of Oceanography, he has continued his father’s CO2monitoring program, as well as established a new one, for oxygen.
During a stay at the Bjerknes Centre in Bergen, he recalls a friend from college visiting his home. His father had spread his work with CO2 measurements across the table and started to explain.
“My friend turned to me and said, ‘Wow, that looks like really clean data’,” says Ralph Keeling.
“There is something about the curve that’s gripping me because it’s so clean. You usually think of data jumping around and flickering, with a lot of scatter and noise. This record doesn’t look like that. It looks like every point is telling you something real. It’s charting the course of the planet in a really powerful way.”
The CO2 curve rises from year to year, almost every year more than in the previous one. Yet, what first became apparent to Charles Keeling when he began measuring, was not climate change.
Expressions of nature and humanity
The Earth’s fields and forests drive the curve up and down between winter and summer. While plants grow, they absorb CO2 from the air – most during summer. Mauna Loa is in the Northern Hemisphere, where the air is influenced by the vegetation in North America and Eurasia. As a result, the curve dips in northern summers and climbs back up when winter comes.
«You see the breathing of the Northern Hemisphere in these records,» says Ralph Keeling. «You can see both the human imprint with the overall rise and the natural cycle going by.»
The record goes back to March 1958, when he was one year old.
“I can count my age,” he continues, eagerly. “I can look at my age by the number of wiggles in that curve. It’s changed with time, just like I’ve changed with time.”
Nor is the difference between summer and winter quite the same as seventy years ago, but the overall rise in CO2 dominates the picture. The wriggles of the seasons become smaller and smaller relative to the curve.
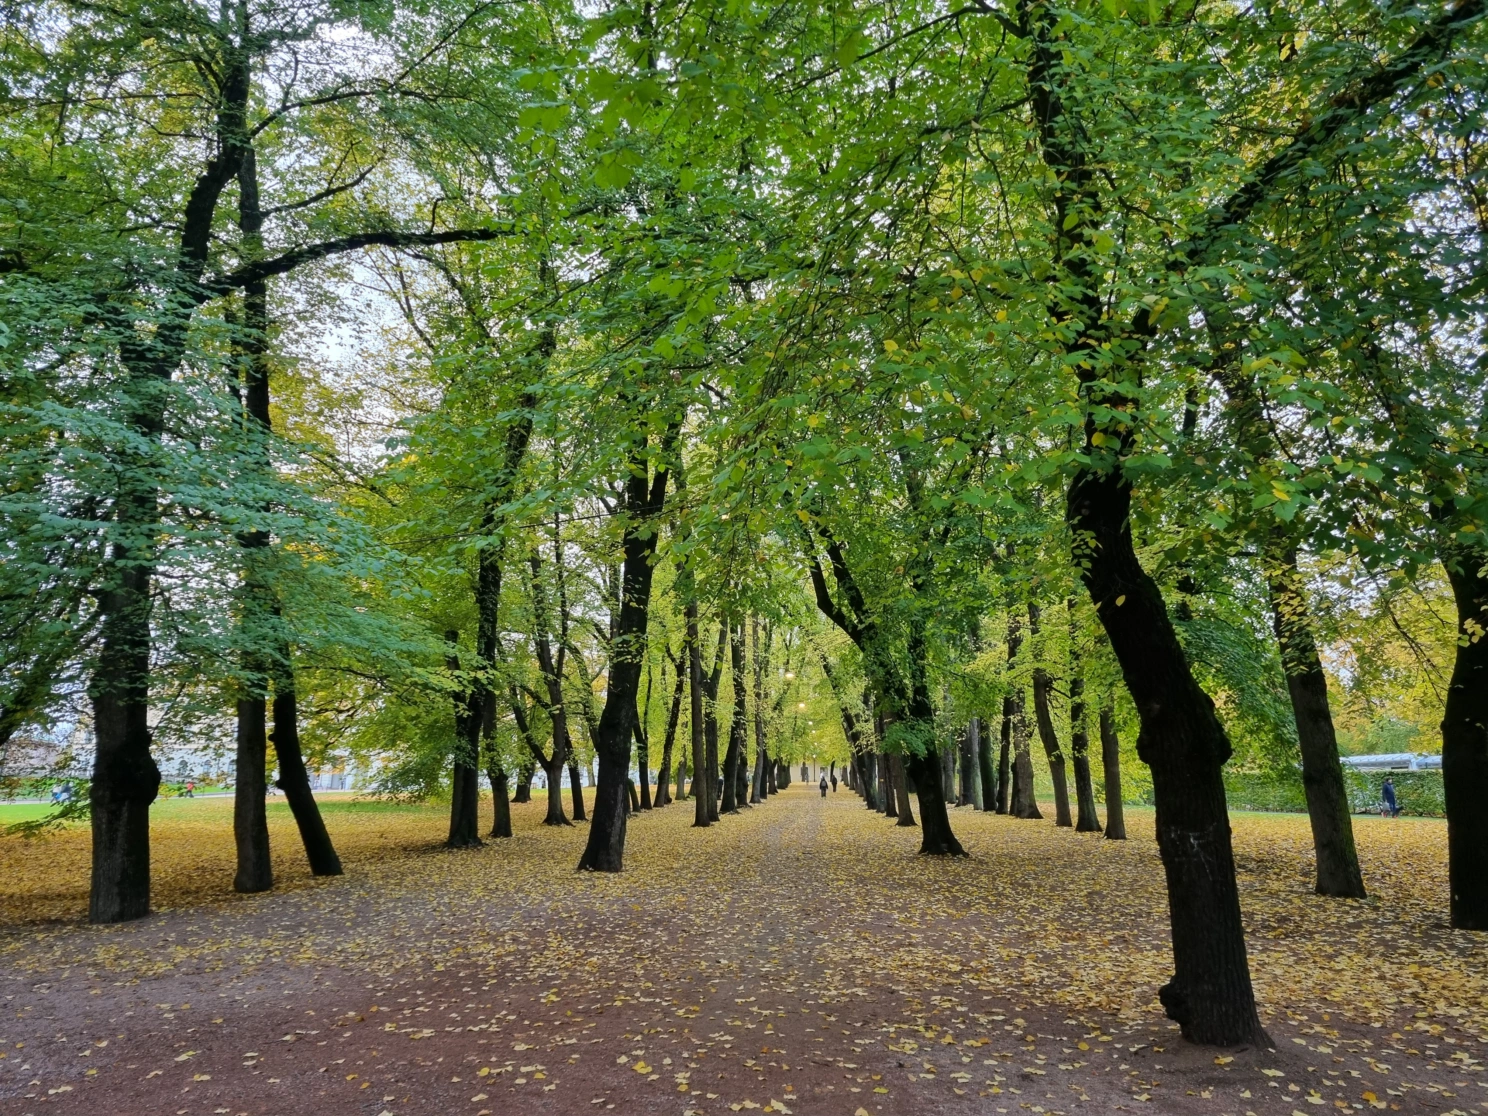
In summer, when trees and other plants receive enough sunlight, they grow by photosynthesis. Through this process the plants use water and CO2 to build sugar molecules, while oxygen is released. As a result the atmosphere contains less CO2 and more oxygen in fall than in spring. Photo: Ellen Viste
A last chance
Only from the late 1980s did it become clear that the Earth’s climate was changing. The changes have continued and will continue. Ralph Keeling says it makes him sad.
“You’re saying goodbye to all these things that people have cherished. On another level, it’s kind of exciting. We’re going on a journey, whether we like it or not. But it’s a journey that’s going to leave a lot of people worse off.”
That Ralph would follow in his father’s footsteps, was not obvious from the start. He wished to work in the natural sciences, but which field?
“I felt that there was something about earth and environmental science that had a stronger connection with our time than other fields,” he says.
“The planet was changing, and we were never going to get another chance to see what it was like if we didn’t go out there and measure it. There was an urgency.”
Aware of the significance of his father’s CO2 curve, he chose to focus of another constituent of the air: oxygen.
Ralph Keeling would be the first to show that the oxygen content of the atmosphere – unlike CO2 – is decreasing. The cause is the same: humanity’s burning of coal, oil and gas.
The oxygen content in the atmosphere decreases. Like CO2, the amount of oxygen oscillates up and down through the seasons, though in the opposite direction. Plants produce more oxygen in summer than in winter, and because these measurements are from Mauna Loa, in the Northern Hemisphere, most oxygen is available after the northern summer. Data shown are deviations in the relationship between oxygen and nitrogen in the air, compared to a reference value. The unit per. meg. corresponds to parts per million.
The significance of oxygen
Across the table at home, Charles D. Keeling had explained to his son that measurements of oxygen would be a valuable supplement to those of CO2.
Regardless of whether one sets fire to young twigs or ancient oil, the burning releases CO2. The difference is that fossil fuel disrupts the balance between the amount of CO2 emitted and the amount reabsorbed by nature.
Not all CO2 released from smokestacks and exhaust pipes stays in the atmosphere. Some disappears in the ocean; some is taken up by growing plants. If you know how much CO2 has been released and measure the content still in the air, you can easily calculate how much is missing.
But where did it go? With CO2 data only, it is not possible to find out whether the remainder lies in the deep ocean or has turned into pine needles and oak trunks. Add oxygen, and you can separate the CO2 uptake of the ocean from that of vegetation.
When substances burn, they react with oxygen from the air and release CO2. The theory of combustion goes all the way back to the French chemist Antoine Lavoisier in 1778.
Humans and other animals work by the same principle. Every time we breathe, we suck in oxygen that is used to burn the food we have eaten. Breathing out, we release CO2.

Through photosynthesis plants take up CO2 and release oxygen. When something burns, the opposite occurs – oxygen is used and CO2 released, whether the burning material is freshly grown grass or ancient coal. Respiration in the cells of humans and animals works similarly, fueled by food. Ill.: Ellen Viste
The photosynthesis of plants works in the opposite direction. Plants use CO2 from the air to build cells, while releasing oxygen.
As a result, the vegetation on Earth influences the levels of both CO2 and oxygen. The ocean, on the other hand, has little influence on the on-going changes in atmospheric oxygen concentration.
With measurements of both CO2 and oxygen, as well as knowledge of the amount of fossil fuels burned, it is possible to separate the CO2 uptake of land plants, from that which goes into the ocean.
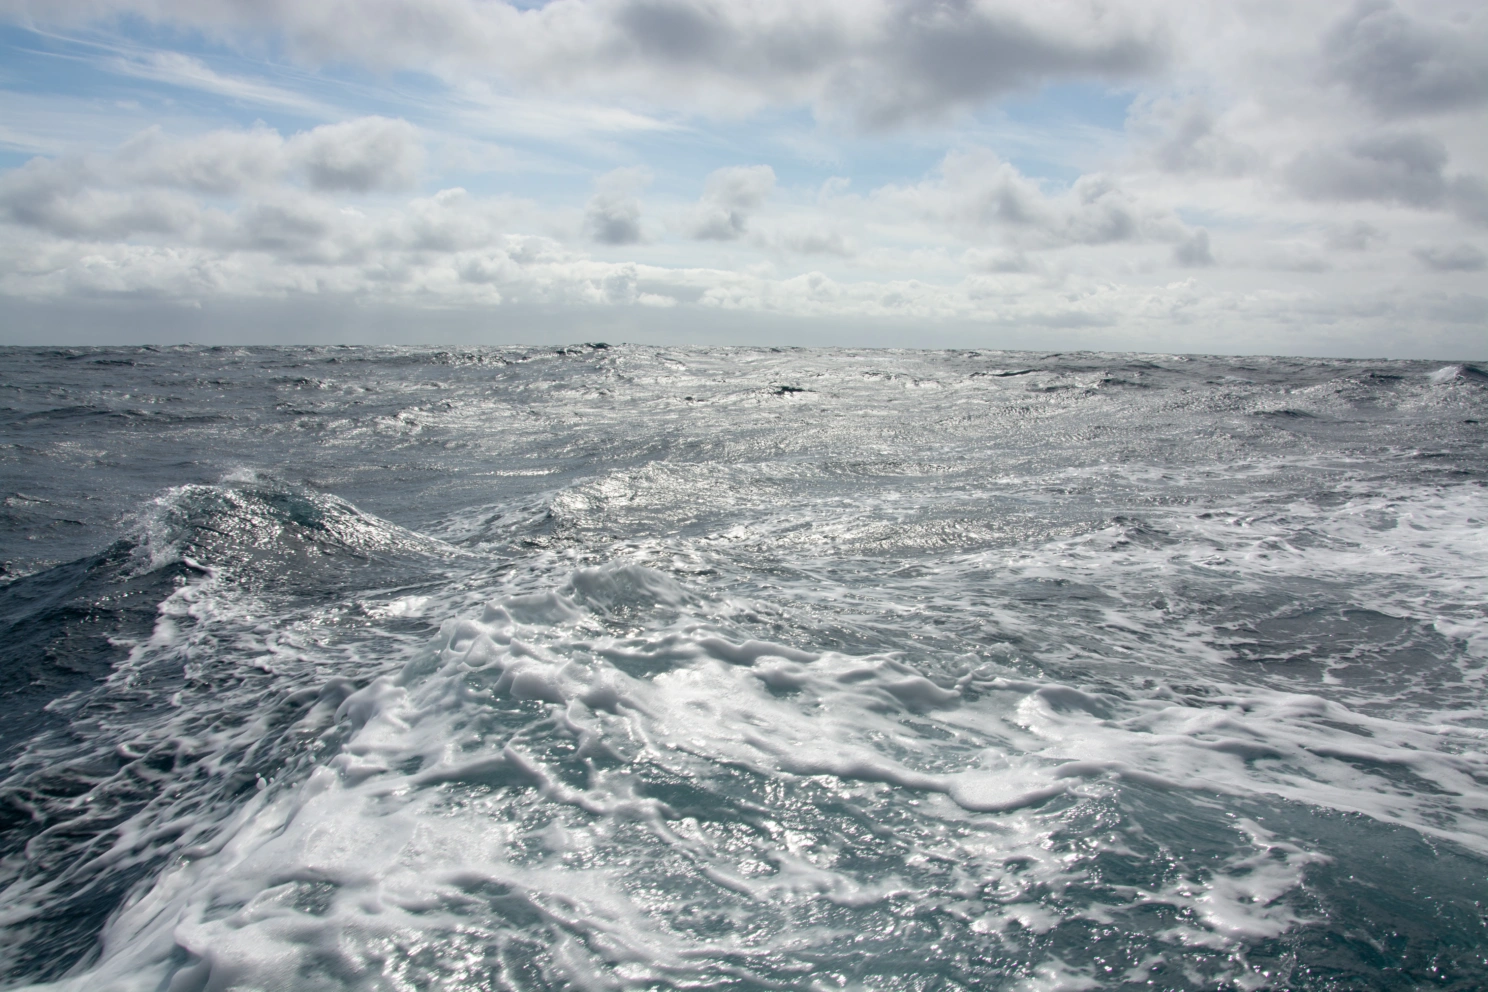
Sea water exchanges gases with the air above. Together with the vegetation on land, the ocean takes up about half of all anthropogenic CO2 emitted to the atmosphere. But as opposed to plants, the ocean has little influence on changes in the atmospheric oxygen content. Photo: Ellen Viste
Did it his way
At the time Ralph Keeling became interested in oxygen, little was known about this gas in the atmosphere, except that it constituted around 21 percent of normal air. Measuring oxygen was difficult.
His father did not encourage him to go into that field.
“He said, someone else is already doing that, so why should you do it? I said, no, I’ve got my own idea. I want to do it my way.”
Five years would pass before his instrument was ready. Even then he lacked methods to collect and handle the air, which would take several years to get in place. A lot could have gone wrong.
“Maybe I would have been better off if it had,” Ralph Keeling ponders. “I could have gone on and done something more important. You get kind of locked in based on your successes, because people expect you to continue to do something.”
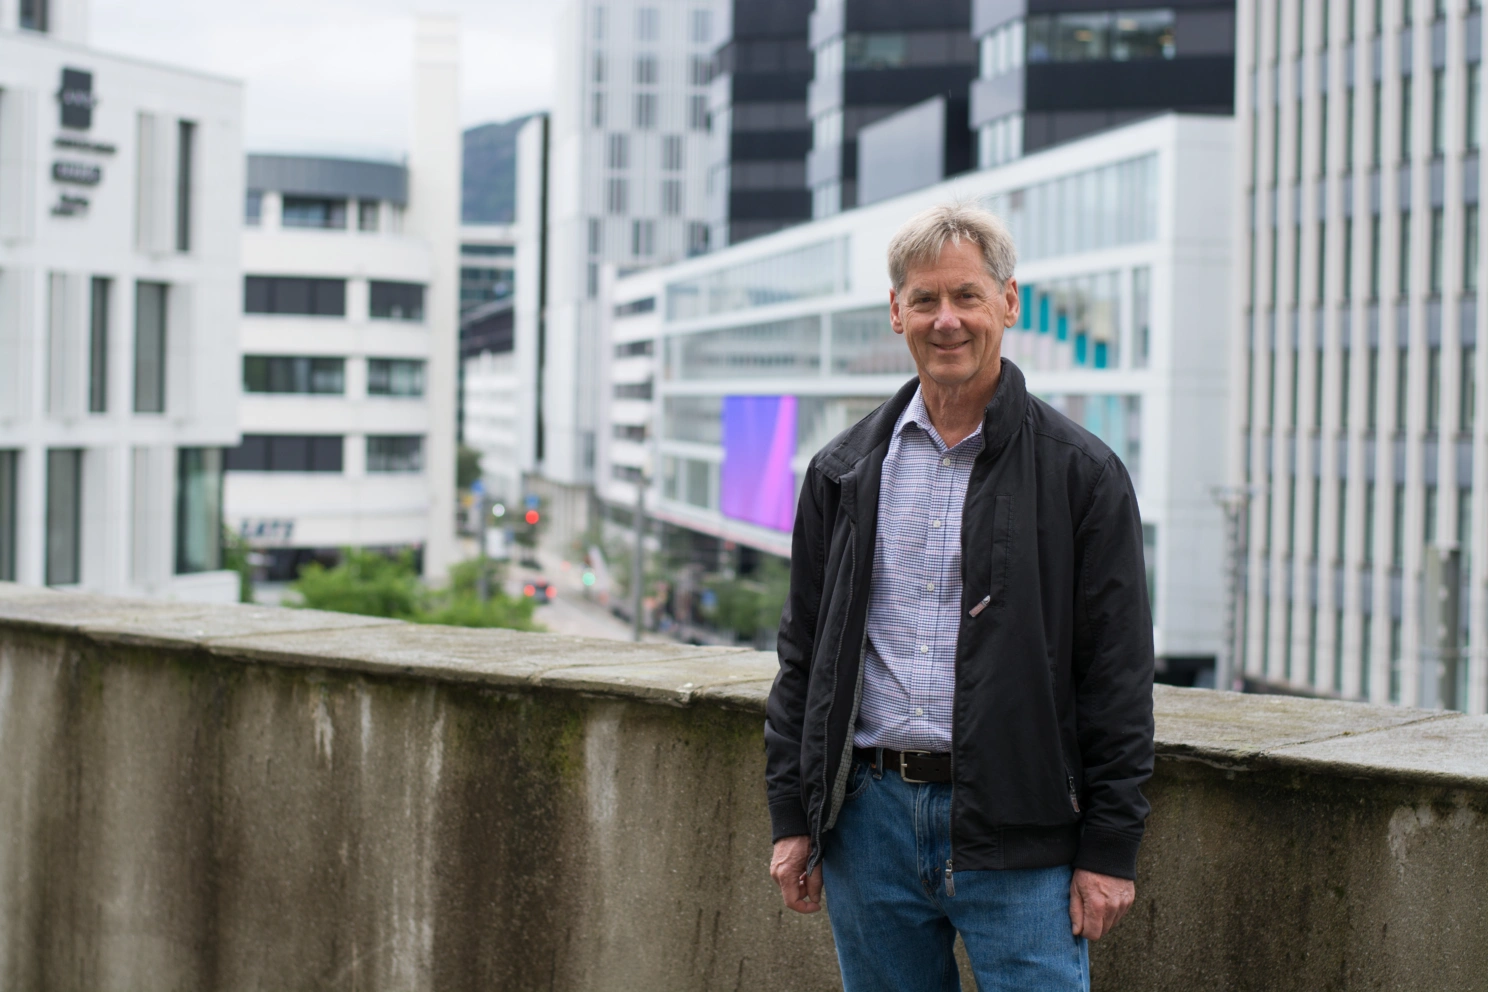
Measuring oxygen brought together several things that appealed to Ralph Keeling: working with a changing planet, with something important and with an experimental challenge. While in Norway, he explored the possibility of starting measurements in Finnmark, bordering the Barents Sea. Photo: Ellen Viste
Turning the curve
Over the years, Ralph Keeling’s data proved that the oxygen concentration in the air declines because we burn substances that have been lying underground for millions of years.
The changes are too small to hamper our breathing or make it harder to light a fire. However, the development is an indicator of what our planet is going through.
Will we see the Keeling curve turn? May CO2 levels start going down and the record from Mauna Loa prove that the world is heading in the right direction? Not in a long time, reasons Ralph Keeling.
“If we turn around the clock and start reducing the burning of fossil fuels as fast as we have increased it, we’ll eventually end up burning twice as much as we’ve already burned. What is that going to do for the planet? Horrendous things. It plays out slowly. What you perceive is that suddenly something has changed, and it’s not going back.”
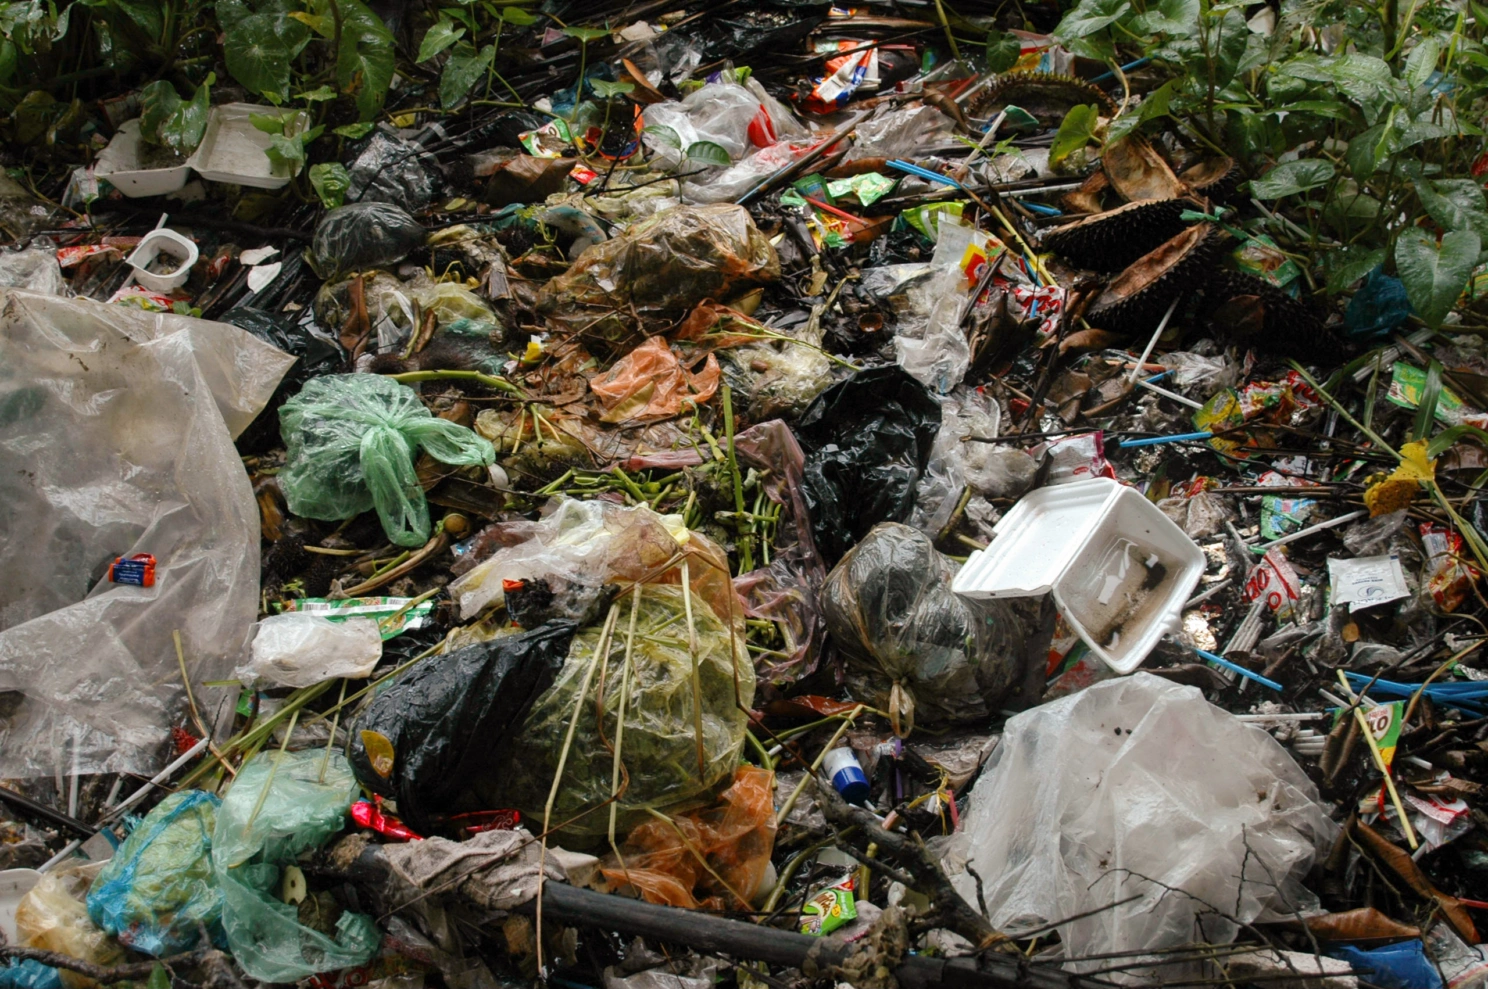
Long-term measurements of environmental problems like plastic pollution would be beneficial. But some things are hard to measure. Photo: Ellen Viste
The way ahead
CO2 has been measured at Mauna Loa since 1958. Ralph Keeling's oxygen data go back to around 1990. What is next? In a hundred years, is there something we will appreciate having a hundred-year record of, something urgent to start now?
“There is no Keeling curve for plastic,” says Ralph Keeling.
He imagines that other fields could benefit from the kind of persistent monitoring performed more for climate than for other environmental problems. At the same time, he points to the difficulties in measuring living ecosystems like forests, the productivity of the oceans or anything down in the ground, out of view from the eyes of satellites.
“You can’t just go out and do a survey and then do another survey twenty years later and get a clear sense of what’s happening,” he emphasizes. “We’re living on a planet that’s changing decade by decade.”
For many scientists it may seem less tempting to initiate long-lasting, long-term measurement series while it is easier to get funding if promising quick results. But the discoveries hidden in long measurement records, are of no smaller scope.
“It’s not like we’re measuring the planet in a boring time,” says Ralph Keeling.
References
Recording Earth’s Vital Signs
Is Carbon Dioxide from Fossil Fuel Changing Man’s Environment?
Bjerknessenterets podkast om hockeykøllegrafen